 geonetworktest
Norwegian Water Resources and Energy Directorate
Type of resources
Available actions
Topics
Keywords
Contact for the resource
Provided by
Representation types
Update frequencies
status
Service types
Scale
-

Flood hazard maps show areas that are prone to flooding at various flood levels ( return periods). Flood hazard maps are prepared for floods with 20-, 200- and 1000-year return period. In areas where climate change is expected to increase water discharge with more than 20%, flood hazard maps are being prepared for a 200-year flood in the year 2100.
-

Susceptibility areas for rockfall is a national series of maps showing areas that are potentially vulnerable to rockfalls at a general level. The maps show potential source areas and run-out areas for rockfalls.\\nYour attention is drawn to the fact that the areas covered by source areas are in practice run-out areas as well, as avalanches that are triggered right at the top of the source area move through trigger areas below, before reaching the run-out areas at the bottom. Therefore, both source areas and run-out areas should generally be used together when using the dataset for analysis purposes. \\nThe susceptibility areas are identified by means of a data model which uses the slope of the terrain and geological information to recognise potential source areas for rockfalls. The run-out area for rockfalls is calculated automatically from each source area. No fieldwork is done when identifying or defining the areas.
-
-

Overview of the high voltage subsea cable network in Norway. This includes central, regional and high voltage distribution networks, i.e. networks with a voltage of 1 kV and above.
-

The dataset shows the mapping of land use interests in the 15 assessment areas identified in the report "Havvind – Forslag til utredningsområder". Impact assessments have been carried out for business, community and environmental interests in and around the assessment areas, and the technical-economic suitability of the areas has been assessed. The impact assessments have been carried out at a general level, and the objective of the Norwegian Water Resources and Energy Directorate has been to obtain knowledge of the assessment areas that would be of relevance to decisions. This should provide a sufficient knowledge base so that recommendations can be given concerning the opening of areas for licence applications for the development of offshore wind farms.
-

This product is a result of the Norwegian Water Resources and Energy Directorate's takeover of governmental administration responsibility for landslides in 2009. The service is intended as an instrument that will make it easier to gain an overview of unstable rock sections and associated consequences. Hazard and risk mapping is carried out by the Geological Survey of Norway on behalf of the Norwegian Water Resources and Energy Directorate. How the follow-up of the unstable rock sections and hazard zones should be followed up with monitoring and in land use planning is described in Norwegian Water Resources and Energy Directorate report 77/2016: Fare og risikoklassifisering av ustabile fjellparti. Two databases have been established for distributing the mapping and hazard areas. The Norwegian Water Resources and Energy Directorate's database distributes hazard zones for run-out areas and tidal/tsunami waves, as well as potential damming areas and downstream flooding as a result of dam break, where appropriate. The Geological Survey of Norway database focuses on the geological data, including displacement measurements. The Norwegian Water Resources and Energy Directorate's mapping is aimed primarily at existing development. When identifying and prioritising areas in need of continuous monitoring, emphasis is therefore placed on where people live and spend time within areas that are potentially at risk of landslides and areas that will be affected by tidal waves/tsunamies or damming/dam break as a direct consequence of a rockslide. The database is a product of the mapping and the hazard and risk classification that have taken place. Together, this should provide a basis for assessment of measures in the form of monitoring with the aim to provide notification of future rockslides, hence preventing the potential loss of human lives. Mapping provides important information on the degree of danger as a basis for spatial planning.
-
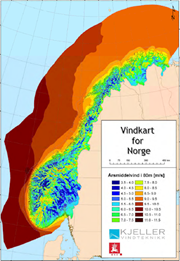
Kjeller Vindteknikk has on assignment from NVE made a national feasibility study of the available wind resources, both onshore and offshore. The map product has a horisontal resolution of 1x1km, and gives annual avarage at 50, 80 and 120m above the ground. The maps are available as downloadable PDF-files. In addition to available wind resources, maps of terrain complexity and risk for icing has been developed. Terrain complexity maps are an indicator on the vulnerability of turbolent air flows in an area. Turbolent air flows can be a challenge for wind turbines and will normally contribute to reduced power production and increased wearing on the wind turbines. Icing on turbine blades can be a problem in exposed areas, especially at higher altitudes, and contributes to reduction in power efficiency and power production.
-

Database of catchment areas (def. in REGINE) which drain to a water intake for power production. Attribute data is made up of catchment no., catchment name, name and no. of associated hydroelectric power station, area, mean annual inflow and downstream catchment
-

-
